biebr: Buried Insight Extractor and Box Rejigerrer
Welcome to biebr, an even hipper, slicier and dicier way than slysr for exploring your multivariate datasets! Why stare at tables of numbers when you can explore multi-dimensional space from the comfort of your own desk?
This script helps you gain insight into your data by visualizing it in many different ways (haha, just kidding -- you can only use treemaps for now). Check out this link for a brief rundown and history of treemaps and why they're awesome.
Instructions
-
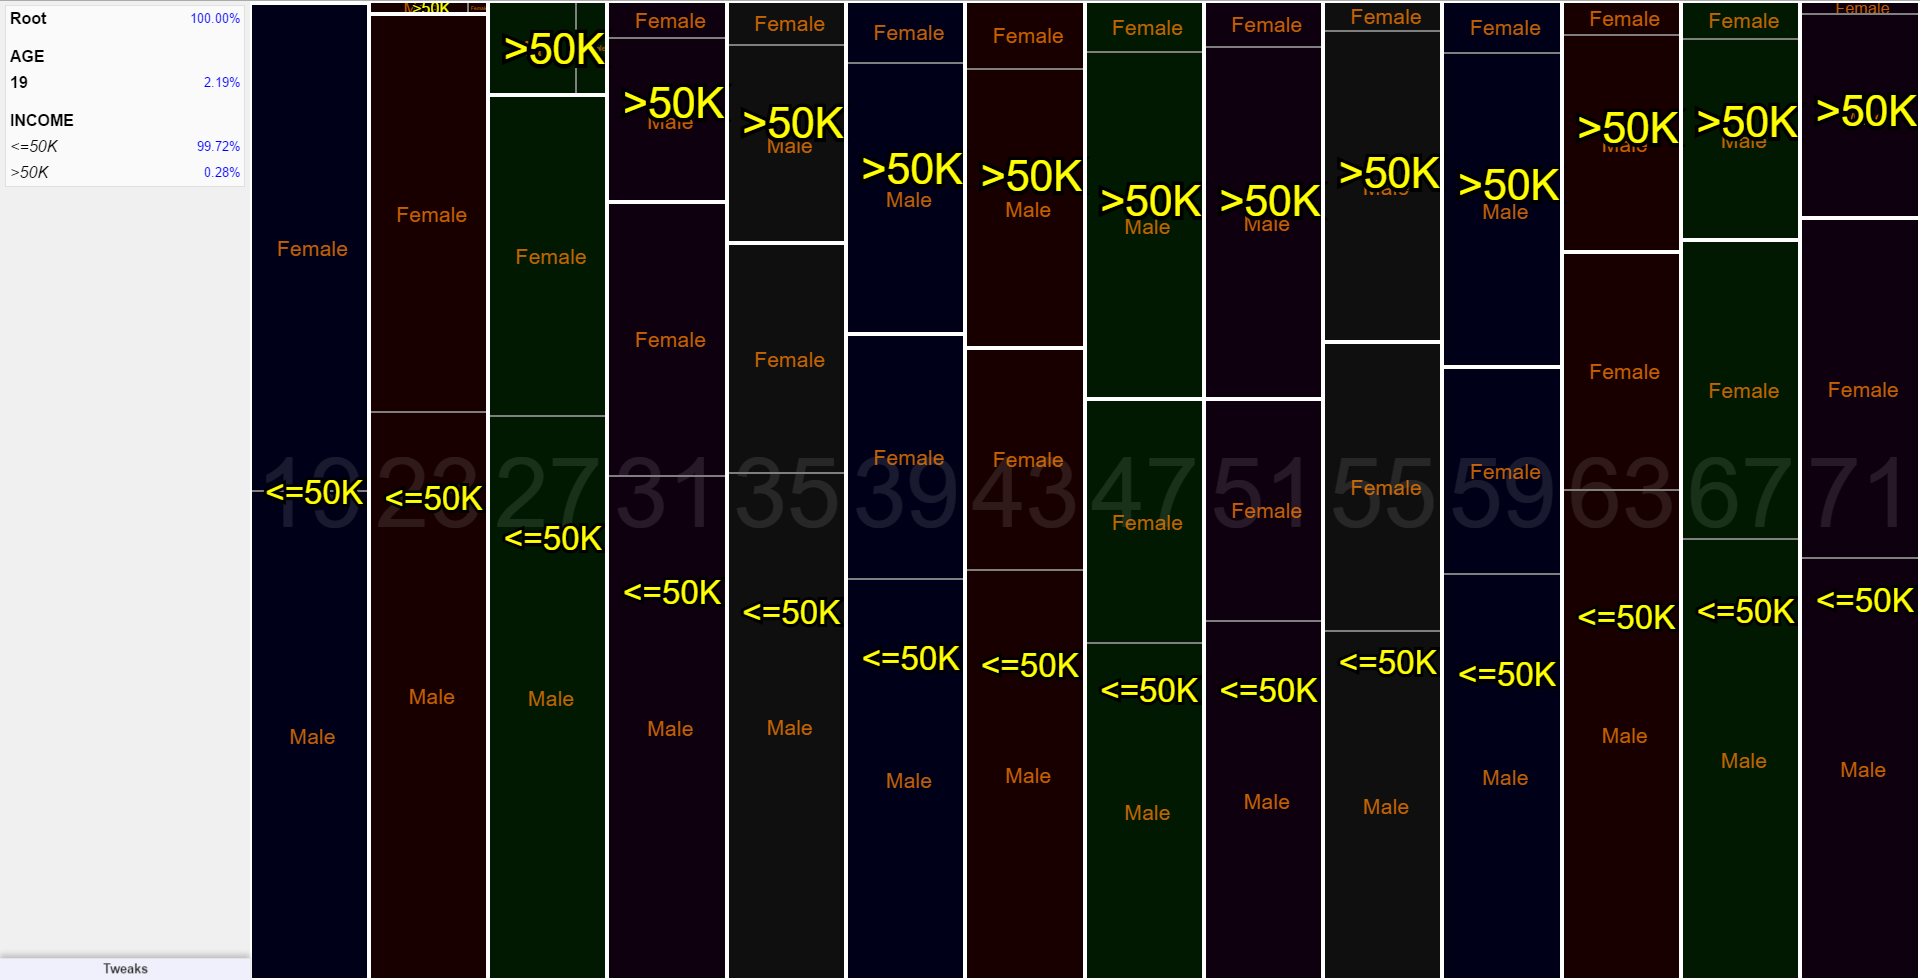
Data is shown as nested boxes, with each level breaking down one variable of
your data. Box size is determined by how frequently its data appears with
respect to its siblings.
- Clicking a box will dig deeper into the data for a particular value, crafting a new visualization for just that box.
- Shift+clicking a box will back up one level higher in the data.
- Hovering over a node will show information about the node in the sidebar.
-
The sidebar displays info about the current node of interest.
- Clicking on a row will visualize that particular node.
- Shift+clicking a row will create an visualization to the right of all the current ones for that particular node.
- Hovering over a row will highlight the node in the visualization on the right.
-
The "Key ordering" menu in the bottom-left changes in what order the data properties
are pivoted. Data is pivoted from top to bottom.
- Clicking on an arrow will swap the ordering of two headers.
- Click "Rebuild data hierarchy" on make your swaps take effect.
-
The "Tweaks" menu changes how the visualization is drawn.
- Nuke extra visualizations removes all side-by-side visualizations.
- Descriptions of the other items are shown next to the widgets.